
Key takeaways
- Live visitor data allows for proactive operational management, a significant advance on historical analysis.
- Dwell time is a direct measure of exhibit engagement and can guide future capital investment.
- Connecting visitor movement data to spending reveals key drivers of retail and catering performance.
Beyond the Ocean Tunnel Pinch-Point
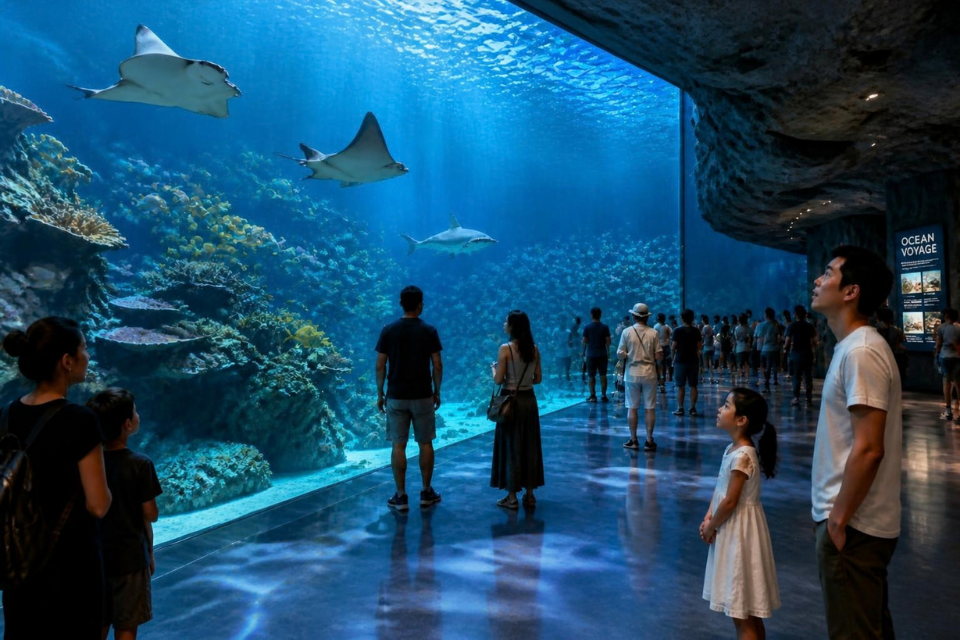
Every aquarium has one. That spot where the visitor flow grinds to a halt. Often it is the main ocean tunnel or the giant central tank. A family stops for the perfect photo, and suddenly a queue snakes back through two other zones. Duty managers do their best to manage it, but they are always reacting. You know the attendance figures for the day, but you do not know where those people are right now. This is the fundamental challenge of managing a dynamic visitor attraction.
Understanding aquarium visitor data allows a shift from a reactive to a proactive operational stance. It involves looking past simple ticket scans and annual pass holder numbers to get a live, granular view of how guests experience your attraction minute by minute. This intelligence is key to smoother operations, better staff allocation, and an improved guest experience.
From Headcounts to Real-Time Flow Management
Seeing the Blockages Before They Happen
Traditional footfall counters give you a total. They do not tell you that three-quarters of your visitors are currently clustered in the 'Rainforest Rivers' zone, whilst 'Coastal Rockpools' is almost empty. This is where visitor intelligence from a guest experience platform becomes so effective. By using technologies like Wi-Fi positioning and GPS within a visitor app, you can generate a live heatmap of your aquarium.
Picture this: a new 'Shallow Seas' exhibit is proving more popular than anticipated. Your live heatmap shows a persistent red spot of high density. People are lingering, causing a blockage that affects flow into the next two zones. Your duty manager sees this on their dashboard. They can dispatch a staff member to help manage the crowd, or use push messaging to suggest visitors explore a quieter area first and return later. This is active, data-informed management.
Dwell Time: Your Most Honest Exhibit Critic
Dwell time data reveals if that expensive new display on plastic pollution is working as intended. If visitors spend, on average, less than thirty seconds at the display before moving on, it suggests something is wrong. The instructions might be unclear, the screen too high for children, or the content simply uncompelling.
Conversely, high dwell time shows what truly captivates your audience. You might find a simple, low-tech tank of seahorses holds attention three times longer than a more expensive installation. This data is gold dust when planning capital expenditure, providing hard evidence of what your visitors actually value.
- Low dwell time at a new exhibit can signal a problem with its design, location, or content.
- High dwell time at a particular talk or feed can justify adding more sessions to the daily schedule.
- Comparing dwell times between different zones helps you understand the overall pacing of the visitor journey.
Deploying Your Team with Precision
Staffing is one of your biggest operational costs. Getting it right has a direct impact on your bottom line and the quality of the visitor experience. Visitor data can help turn your staff rotas from a fixed plan into a dynamic resource.
For example, data from your visitor app might show that 15 minutes after the main penguin feed finishes, there is a predictable surge of visitors moving towards the main café. Armed with this insight, you can ensure the café is ready. You can open an extra till point just before the rush hits, reducing queues and frustration. You can also see which areas are quietest and when, allowing for more efficient cleaning schedules or for staff to conduct maintenance without disrupting guests.
Connecting Visitor Journeys to Secondary Spend
Understanding 'Why' They Buy
Your gift shop and café are vital revenue streams. It can be hard to know the relationship between a visitor's experience and what they buy. Perhaps the person who bought the shark toy spent the most time at the shark tank. Maybe the family who bought four ice creams did so right after visiting the hot and humid Amazon zone. Without connected data, you can only guess.
This is where digital memberships and in-app commerce, integrated within a platform like n-gage.io, show their value. When a member uses their digital card to get a discount in the shop, you can (with their permission) link that purchase to their movement data for the day. You start to build a picture of cause and effect. You might discover that people who attend the otter talk are 50% more likely to buy otter-related merchandise. This allows for targeted promotions and smarter product placement.
Measuring the True Success of Your Events
Ticket sales for a special 'Ocean Giants' weekend may be up, but what was the real impact on the guest experience? Visitor movement analysis provides the answer. It shows if attendees made a beeline for the whale talk and then left, or if the event encouraged them to explore other parts of the aquarium.
By comparing heatmaps and flow diagrams from the event weekend to a typical weekend, you can see exactly how behaviour changed. This helps you measure the true return on investment for your marketing spend and programming efforts. It informs how you should structure the next event.
- Analyse whether the event lifted dwell time across the entire site or just in one location.
- Identify which talks or activities drove the most secondary spend in the café or shop.
- Determine if the event attracted a new demographic and how their behaviour differed from your typical visitor.
Your Practical First Steps
Moving towards a data-informed operation does not require a huge, disruptive overhaul. It can be an incremental process.
Start with a Question
Before considering new technology, define one or two key operational questions you want to answer. For instance, you might be most concerned with entrance queues or want to understand why café revenue is flat. A clear objective will focus your efforts.
Audit Your Current Data
Look at what you already have. This could be ticketing data from your EPOS system, website analytics, and any feedback you collect. See where the gaps are. The biggest gap for most attractions is what happens between the front gate and the exit.
Explore the Possibilities
Begin a conversation with providers of guest experience platforms. Ask them to show you how their system could specifically solve the problems you have identified. A good partner will work with you to build a business case, starting small and demonstrating value at every step. The goal is to gain the visitor intelligence you need to make better decisions every single day.
Want this applied to your attraction?
We are happy to talk through your own plans, even at an early stage.
More for aquariums
How aquarium visitor data can drive commercial growth
A guide for aquarium operators on using visitor intelligence to drive commercial growth, from increasing on-site spend to boosting membership and donation revenue.
Read articleAquarium visitor experience: keeping the whole route interesting
Learn how to enhance the aquarium visitor experience by improving on-site navigation, managing crowds, and increasing spend with a dedicated guest app.
Read article